Matlab
Optimization
See pages for CPLEX and other optimization solvers.
Some Readings
- (LINK) - Common Problems with MATLAB
- (LINK) - Maximizing MATLAB Performance
- (LINK) - Optimizing for Speed
- (LINK) - Matlab - faster scripts
- (LINK) - Matlab vectorisation tricks
- (LINK) - Code Vectorization Guide
- Econometrics Toolbox for MATLAB
MATLAB Central File Exchange
save2pdf - Save figures as PDF filesfig2texPS - Export MATLAB figures to LaTeXmatlab2tikz - Save MATLAB figures astikzpicture in LaTeX.
Recipes
Some useful expressions
- Custom function
x = fminunc(@(x) myfun(x,a),x0);
myfun = @(x) x+2+a;
- 2D plotting of 3D data
plot([1:10], squeeze(r(1,1,:)));
- Repeat matrix
repmat(A, [1,1,N]);
- Setting font sizes in plots
set(0,'DefaultAxesFontSize',14)
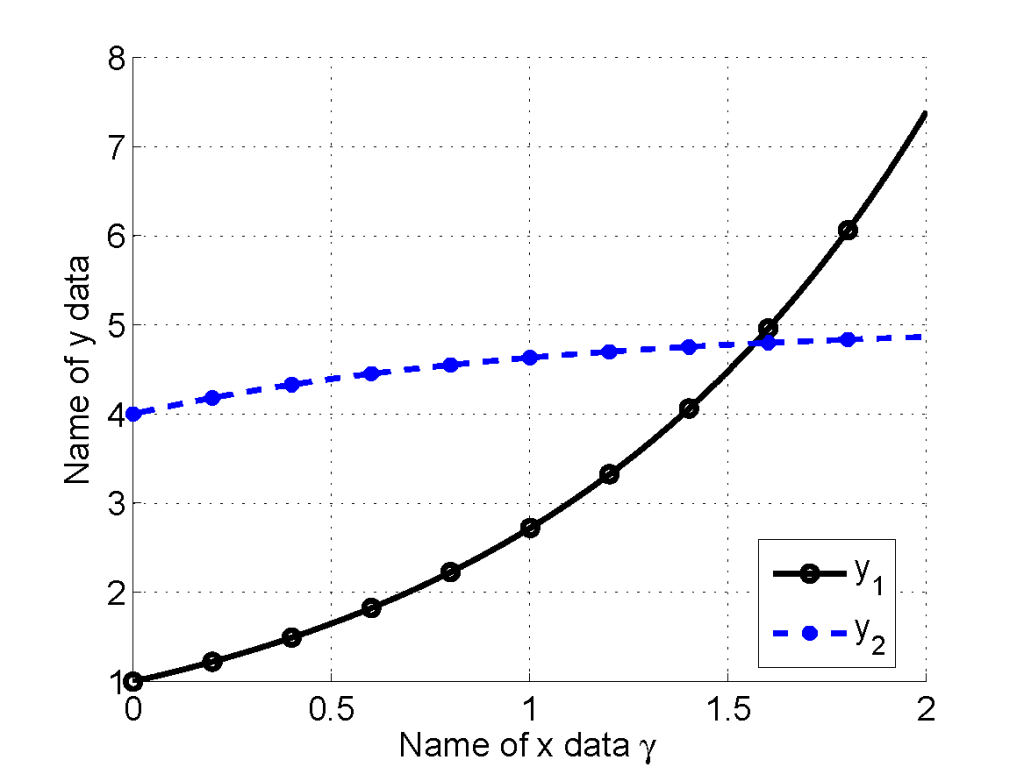
How to control the number of markers in figure?
When the size of data is large, using markers in plot is a pain. MATLAB simply puts all the data points with markers, so the plot looks very ugly. I found that drawing three times for a data series looks stupid, but definitely works. Please see the following codes as an example:
num_data = 200;
num_marker = 10;
marker_space = num_data / num_marker;

% x data
x = linspace(0,2,num_data);

% y data
y1 = exp(x);
y2 = 5-exp(-x);

% make font size big
set(0,'DefaultAxesFontSize',14)

% draw a figure
fig1 = figure;
hold on; grid on;

% (1) these two for legend
plot1 = plot(x(1),y1(1), 'ko-','LineWidth',2);
plot2 = plot(x(1),y2(1), 'b*--','LineWidth',2);

% (2) these two for markers
plot(x(1:marker_space:num_data), y1(1:marker_space:num_data), 'ko','LineWidth',2);
plot(x(1:marker_space:num_data), y2(1:marker_space:num_data), 'b*','LineWidth',2);

% (3) these two for lines
plot(x,y1,'k','LineWidth',2);
plot(x,y2,'b--','LineWidth',2);

legend('y_1','y_2','Location','Best');
xlabel('Name of x data gamma ');
ylabel('Name of y data');

% save the figure as a 600-dpi PDF file
save2pdf('figure_filename',fig1,600);
To save the figure as a PDF file, I recommend save2pdf. The result is: